Diagnose
Account, offer, funnel and data against one question. Where is the broken link?
There are two kinds of spend. Spend that buys sales, profitable at the ad level and flat at the business level. And spend that buys growth. Most accounts are full of the first kind, and no amount of bidding fixes that.
I take ownership of the number, not the channel.
It is one broken link in a six part system. Strategy, acquisition, creative, CRO, analytics, scale. I find it, rebuild it, and stay accountable for the outcome.
No pitch. A straight diagnosis of where your growth is stuck.
Every figure above is one screenshot away from being proved. Sources: the May 2026 Google Ads export and eight years of accounts across Google, Meta, Snapchat and LinkedIn.
accounts owned end to end
platforms: Google, Meta, Snapchat, Shopping
continents: Europe, Australia, North America
business models: ecommerce, wholesale, service
Across every account I have audited, the cause has been in one of these three places almost every time. Each one below is a real finding from a live account, not an example.
The same message reaches the same people more often. Spend climbs, reach does not, and the platform reads saturation as creative fatigue.
In a supplements account, the single best performing ad set was returning 9.98x. It was also running at a frequency of 8.31. It was two to three weeks from collapse and the dashboard showed no sign of it.
Platform numbers and business numbers disagree, so decisions get made on whichever dashboard is open. Budget follows attribution instead of profit.
1,004 of 1,844 reported purchases in one Meta account were view-through credit. Shopify never recorded them. Reported return was 4.5x. Real return on click was 2.1x.
The account, the offer and the landing path were each built for a smaller business. At three times the budget they start working against each other.
One Shopping campaign sat on a A$1,500 daily budget and spent A$34.89 across an entire month. Five hundred and ten impressions. Not a bidding problem, a delivery problem nobody had looked for.
The Facebook dashboard reported a 4.5x return on ad spend. Shopify did not agree.
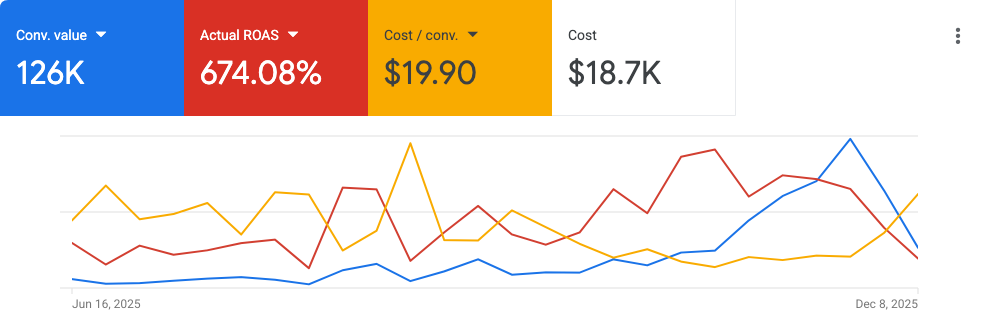
Each headline states what moved in the business; the platform figures sit beneath it as support. Exports display in full rather than cropped to a band.
Six domains, one owner. Split them across vendors and the seams are where the growth leaks. Every stage below feeds the next.
No pitch. A straight diagnosis of your account.
Before any budget moves, I agree what the account is actually for. Which customer, at what margin, at what volume. Most accounts underperform because they are still buying the customer the business used to have.
Channel targets nobody can tie back to profit.
Account structure across Google and Meta built for the budget you are heading to, not the one you have. Intent tiers so budget can move daily without resetting learning.
Every budget increase costs a fortnight of relearning.
Angles briefed from customer language and search terms, not from last quarter's winner. I direct the people producing the work and judge it on cost per sale, not on engagement.
Refreshes look different and say the same thing, and frequency keeps climbing.
The path after the click. The landing promise has to match the ad promise, and the form has to ask for the minimum that still qualifies the lead.
You pay full price for traffic that a two-field change would have converted.
One number that finance and the ad account both sign off on. Attribution windows set to what the business can bank, not to what makes the dashboard look best.
Budget follows whichever dashboard is open.
Spend expanded against contribution margin, with the next ceiling named in advance. Volume rises and cost per sale holds or falls.
Growth that reverses the moment budget increases.
If yours is not here, ask it on the call.
There is no rate card on this site, because a fee quoted before I have seen your numbers is a guess. Both models are scoped after the diagnostic call, once we both know what the constraint is and what fixing it takes.
I am in the accounts. Where volume needs more hands, I direct the people producing the work and I stay accountable for what they ship. You have one person to call either way.
Around A$10K a month. Below that the constraint is usually the offer, the price or the product, and paid media will not fix any of those. I will tell you that on the call rather than take the retainer.
The diagnosis takes two weeks. Structural changes show up in the numbers inside thirty to forty five days, because that is how long the platforms need to relearn. Anyone promising faster is changing bids, not systems.
One client at a time in a category. It is the only way ownership means anything.
Read access to the ad accounts and analytics, the last three months of revenue, and a decision maker in the room. Ten minutes of preparation on your side saves half the first call.
Account, offer, funnel and data against one question. Where is the broken link?
One page. The constraint, the bet, the number, and what we stop doing.
Structure, creative and landing path rebuilt for the budget you are heading to.
Spend expanded against contribution, not last click. Volume up, cost per sale down.
Written playbook and a team that runs it, so the system outlasts the engagement.
I run the growth system with you and carry the number. Strategy through scale, in your meetings, directing the teams executing.
Ongoing · monthly · one client at a time in a category
A fixed engagement that finds the broken link and hands you the plan to fix it. Your team executes. I stay available while they do.
Fixed scope · three weeks · ends in a decision document
Buying more media is the most expensive way to avoid fixing the system.
Bring the account, the numbers and the problem as you understand it. You leave knowing where the broken link is, whether or not we work together.
A read on where your growth ceiling actually sits, across all six parts of the system.
Which of frequency, measurement or structure is costing you the most right now.
What fixing it would take. Scope, sequence and who does what.
A straight answer on whether I am the right person to own it.
Thirty minutes, held on Google Meet. The link is in the calendar invitation.